Why cost per occupied room is the GM’s real control panel
Revenue metrics can flatter a hotel while the real costs quietly swell. When you track hotel cost per occupied room as closely as you track RevPAR, you finally see how each occupied room reshapes profit on a daily basis. That single view connects labor, amenities and operating expenses to every guest night in a way owners instantly understand.
Think of CPOR as the bridge between the P&L and the marketing funnel, because every room sold carries a specific cost room profile that your team can influence week by week. GOPPAR can look stable while labor cost per occupied room, cleaning supplies per stay and housekeeping labor hours drift upward, eroding margin in the background. When you decompose the total room economics into rate, productivity and mix, you see which occupied rooms are actually worth fighting for in your next campaign.
For a 250 room hotel with 75 % occupancy, a 3 dollars shift in CPOR can move monthly profit by tens of thousands. That is why a precise CPOR cost view by segment, channel and length of stay matters more than a generic operating costs ratio. When you align marketing, revenue management and operations around the same cost occupied benchmark, every department finally talks about the same number.
Decomposing CPOR into rate, productivity and mix
Start with a simple formula ; total operating expenses directly tied to rooms divided by occupied rooms for the period. Then split that room total into three CPOR drivers ; average rate achieved, labor cpor and the mix of segments that fill your rooms sold. This decomposition lets you see whether rising costs come from wage inflation, inefficient minutes occupied per stay or an unhealthy channel mix.
On the rate side, a higher ADR can justify richer amenities and more generous service, but only if the incremental revenue per occupied room outpaces the incremental cost occupied. Productivity is where labor hours, housekeeping labor and room attendant deployment live, because minutes per room and hours occupied per floor decide how far each dollar of total labor goes. Mix is the hidden lever, since a corporate guest staying four nights with minimal front desk interaction often carries a lower cpor cost than a one night leisure stay with heavy use of amenities.
When you track these three levers separately, you avoid blaming wage rates for what is actually a scheduling and productivity issue. Hospitality Net data shows that wage rates rose only around 3 %, while implied labor cost per hour climbed closer to 8 %, which means labor hours and deployment patterns did the real damage. A CPOR dashboard that isolates labor cost, cleaning supplies and other variable costs per occupied room gives you the clarity to reduce waste without cutting service.
Labor CPOR, housekeeping and the minutes that make or break margin
Labor is the largest controllable component of hotel cost per occupied room, and it is where most hotels lose the plot. Hospitality Net reports that labor CPOR rose 12.8 % across full service properties, from 42.82 dollars to 48.32 dollars per room, with Q4 wage CPOR jumping 21.1 % year over year. Those numbers did not come only from pay rises ; they came from more labor hours being spent per occupied room without a matching lift in guest value.
Housekeeping is usually the first place to look, because housekeeping labor and room attendant deployment translate directly into minutes occupied per stay. When hours per occupied room rise 4.4 % over a year, as the data shows, that means either cleaning standards changed, amenities became more complex or scheduling drifted away from actual occupancy patterns. Each extra five minutes per room, multiplied across hundreds of occupied rooms, quietly inflates total labor and pushes CPOR up even when occupancy looks healthy.
The counter trend is encouraging ; Hotel Technology News notes that in the first half of the following year, hours per occupied room fell again by 3.1 % in full service hotels. That proves the lever can move both ways when GMs redesign workflows, cross train teams and align staffing with real time occupancy data. A focused project on labor cpor, from front desk multi skilling to smarter housekeeping routes, can reduce CPOR without touching the guest facing promise.
Cross training and the economics of multi skilled roles
Cross training is often framed as a service story, but it is fundamentally a CPOR story. When one team member can flex between front desk, lobby service and basic housekeeping support, you reduce idle labor hours and smooth the labor cost curve across fluctuating occupancy. The key is to compare the higher hourly rate of a multi skilled role with the lower labor CPOR it can generate over a week of variable demand.
A detailed analysis of cross training economics shows that a role which costs more per hour can still reduce total labor per occupied room when scheduled intelligently. By mapping labor hours against rooms sold and tracking labor cpor by shift, you see where multi skilled positions absorb peaks without adding full extra headcount. For a deeper dive into this logic, the case study on cross training economics and CPOR is a useful benchmark.
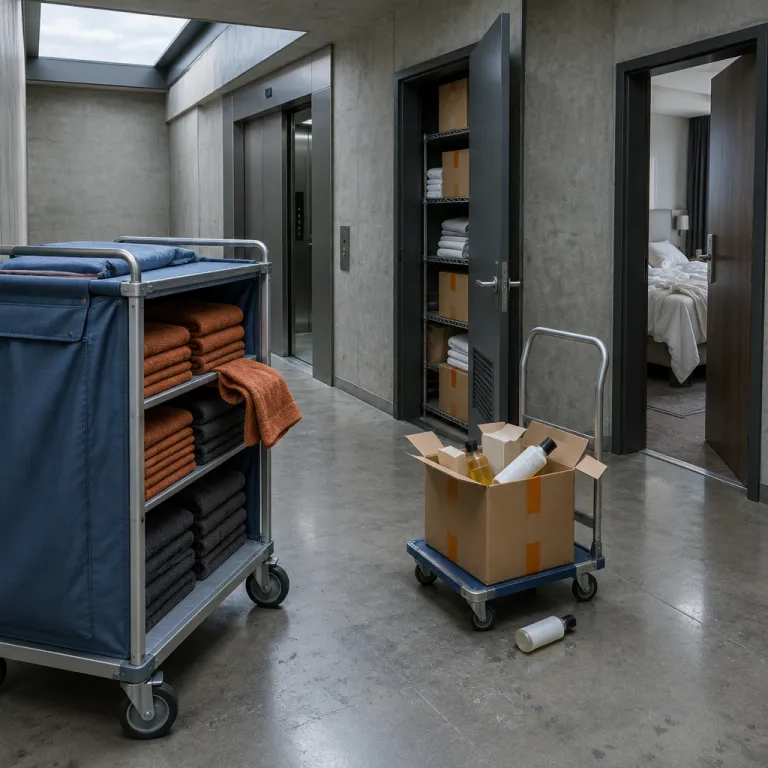
Housekeeping routes deserve the same scrutiny, because the way room attendants move through floors determines both minutes occupied and fatigue. Grouping stayovers and departures by zone, pre staging cleaning supplies and aligning break times with check in waves can cut five to ten minutes per room without touching quality. Over a month, that translates into a lower cpor cost and a more sustainable workload for the équipe.
Why monthly averages hide the CPOR spikes that destroy profit
Most hotel dashboards still report hotel cost per occupied room as a monthly or even quarterly average. That smooths out the violent day level swings where operating expenses per occupied room explode during compressed demand or poorly staffed shoulder nights. A GM who only sees the average never sees the Tuesday where labor cpor jumped 25 % because of misaligned schedules.
To manage CPOR as a real operating metric, you need daily and even shift level data that ties labor hours, cleaning supplies and amenities usage to rooms sold. When you plot CPOR against occupancy and ADR, you quickly see that some high occupancy days carry a much higher cost room profile than others with similar revenue. Those are usually the days where front desk queues, delayed housekeeping and rushed service also hurt guest satisfaction scores.
Day level CPOR analysis also reveals the hidden cost of late check outs, early arrivals and special requests. Each exception adds minutes occupied for housekeeping, extra touches from service teams and more pressure on front desk staff, which all feed into total room costs. Without granular data, those exceptions feel like good service ; with data, you can design paid amenities and upsells that offset the incremental cost occupied.
Redesigning arrival as a CPOR and revenue moment
The arrival experience is usually treated as an administrative step, but it is actually a powerful CPOR lever. A well designed check in flow reduces front desk labor hours per occupied room while opening space for targeted upsells that improve room total revenue. When you shorten low value admin time, you free staff capacity for high value guest interactions that justify a richer service promise.
Digital pre check in, clear communication and smart queue management can cut several minutes per guest at the desk. Across hundreds of occupied rooms, those saved minutes occupied translate into lower labor cost and a smoother lobby experience that supports premium positioning. The analysis on redesigning arrival as a revenue touchpoint shows how operational design and CPOR are tightly linked.
When you connect arrival design to CPOR, you stop viewing technology as a gadget and start viewing it as a way to reduce operating costs per occupied room. Self service options, mobile keys and clear wayfinding do not replace service ; they shift service to moments where it creates measurable value. That is how you keep labor CPOR under control while still delivering a guest experience that supports your rate strategy.
Where CPOR is most controllable ; housekeeping, F&B and amenities design
Not every line of hotel cost per occupied room is equally controllable. Fixed operating costs like insurance or long term contracts move slowly, while variable costs tied to housekeeping, F&B and amenities can be reshaped within weeks. The art is to reduce waste in those areas without cutting into the service elements that drive rate and loyalty.
In housekeeping, the main levers are room attendant productivity, cleaning standards by segment and the design of the physical room. A minimalist room with smart storage, easy to clean surfaces and well chosen amenities can cut several minutes per clean, which lowers housekeeping labor and cleaning supplies per occupied room. When you align design decisions with CPOR data, you stop adding decorative elements that look good in photos but add hidden costs in minutes occupied.
F&B also plays a role in CPOR, especially when breakfast is included in the room total. Buffet design, menu engineering and prep workflows all influence labor hours per guest and food waste per occupied room. By tracking CPOR for breakfast inclusive rates versus room only rates, you can see whether the added revenue covers the incremental operating expenses or quietly dilutes margin.
The danger of cutting CPOR into a service failure
There is a hard limit to how far you can reduce hotel cost per occupied room before you damage the brand. Cutting housekeeping frequency, removing valued amenities or thinning front desk coverage might lower CPOR in the short term, but it can also trigger lower guest satisfaction and weaker pricing power. The segments most sensitive to rate are often the ones most sensitive to perceived value erosion.
For rate sensitive leisure segments, a visible drop in service can quickly translate into lower review scores and higher acquisition costs as you fight to replace lost demand. Corporate travel managers may not track CPOR, but they feel the impact when check in takes longer, service response slows and amenities no longer match the negotiated rate. The goal is not the lowest possible CPOR ; it is the optimal CPOR that supports your positioning and long term revenue strategy.
That is why CPOR analysis must always sit next to guest satisfaction data and channel performance metrics. When a CPOR reduction coincides with stable or improved reviews, you have found real efficiency. When CPOR falls but complaints rise, you have simply shifted costs from the P&L to your brand equity.
Building a CPOR dashboard owners trust ; from GOPPAR story to daily action
Owners and asset managers care about GOPPAR, but they act faster when they see the CPOR engine underneath. A credible CPOR dashboard starts by clearly defining which operating expenses are included in room total costs and which stay in overhead. Consistency matters more than perfection, because you want every stakeholder to trust that an occupied room in the report always means the same thing.
Segment the dashboard by channel, length of stay and room type so you can compare CPOR across different mixes of occupied rooms. When you show that some rooms sold through direct channels carry a lower cost occupied than similar rooms sold through high commission intermediaries, the marketing budget conversation changes. Suddenly, investing more in direct acquisition, CRM and loyalty looks like a CPOR play, not just a branding exercise.
Integrate labor cpor, cleaning supplies per stay, amenities usage and front desk labor hours into the same view, then overlay guest satisfaction and upsell revenue. That way, you can show owners how a small increase in CPOR for a premium segment delivers a larger lift in room total revenue and loyalty. For a strategic perspective on how ownership structures shape these decisions, the analysis on who really owns your hotel brand and what it means for marketing strategy is a useful complement.
A CPOR first budgeting checklist for the next planning cycle
When you build your next budget, start with CPOR targets by segment instead of only setting top line revenue goals. Define clear assumptions for wage rates, then separately set productivity targets for labor hours per occupied room in housekeeping, front desk and F&B. That separation prevents wage inflation from becoming an excuse for sloppy scheduling or inefficient workflows.
Next, model different occupancy and mix scenarios to see how CPOR behaves when more rooms sold come from high touch leisure versus low touch corporate. For each scenario, calculate the impact on total labor, operating costs and GOP margin so you can have an honest conversation with owners about trade offs. Finally, lock in a monthly review where CPOR variances are analysed at day level, and where marketing, operations and revenue management sit together to adjust campaigns, staffing and amenities in one integrated plan.
When CPOR becomes the shared language across departments, GOPPAR stops being a mysterious outcome and becomes a predictable result of daily decisions. That is the shift from storytelling about performance to managing the actual cost per occupied room that your GOPPAR story hides behind. In a market where wage pressure and guest expectations both keep rising, that discipline is no longer optional.
FAQ ; cost per occupied room for hotel leaders
What is cost per occupied room and how is it calculated ?
Cost per occupied room is the total of all variable operating expenses directly linked to rooms, divided by the number of occupied rooms in a given period. It typically includes labor cost for housekeeping and front desk, cleaning supplies, in room amenities and utilities, but excludes fixed overheads like management fees or long term leases. The formula is ; CPOR equals total room related operating expenses divided by occupied rooms.
How is CPOR different from RevPAR and GOPPAR ?
RevPAR measures revenue per available room, while GOPPAR measures gross operating profit per available room across the whole hotel. CPOR focuses only on the cost side of each occupied room, showing how much you spend to service the demand you already have. Together, RevPAR, GOPPAR and CPOR give a full picture ; price, profit and the efficiency of converting occupancy into margin.
Which departments have the biggest impact on CPOR ?
Housekeeping and front desk usually have the largest impact on CPOR because their labor hours scale directly with occupancy. F&B, especially breakfast and in room dining, also influences CPOR when those services are bundled into the room total. Engineering, laundry and security contribute as well, but their costs often behave more like semi fixed expenses than pure variable costs.
How often should a hotel track and review CPOR ?
For operational control, CPOR should be tracked daily and reviewed at least weekly by the leadership team. Monthly averages are useful for reporting to owners, but they hide the day level spikes where labor cpor or amenities usage suddenly jump. A weekly review allows GMs to adjust staffing, workflows and pricing before small variances become structural problems.
Can reducing CPOR damage guest satisfaction ?
Reducing CPOR can damage guest satisfaction if it is done by cutting core service elements that guests value, such as cleanliness, responsiveness or key amenities. The safest CPOR reductions come from eliminating waste ; unnecessary minutes in processes, duplicated tasks between teams or poorly designed spaces that slow work. The goal is to maintain or improve guest satisfaction while lowering the cost per occupied room through smarter design and better productivity, not through visible service cuts.